


New to KubeDB? Please start here.
Monitoring Neo4j Using Prometheus Operator
Prometheus operator provides a simple and Kubernetes-native way to deploy and configure Prometheus server. This tutorial will show you how to use the Prometheus operator to monitor a Neo4j database deployed with KubeDB.
Before You Begin
At first, you need to have a Kubernetes cluster, and the
kubectlcommand-line tool must be configured to communicate with your cluster. If you do not already have a cluster, you can create one by using kind.To learn how Prometheus monitoring works with KubeDB in general, please visit here.
To keep Prometheus resources isolated, we are going to use a separate namespace called
monitoringto deploy respective monitoring resources. We are going to deploy the database in thedemonamespace.$ kubectl create ns monitoring namespace/monitoring created $ kubectl create ns demo namespace/demo createdWe need a Prometheus operator instance running. If you don’t already have one, deploy it following the docs from here.
If you don’t already have a Prometheus server running, deploy one following the tutorial from here.
Note: YAML files used in this tutorial are stored in the docs/examples/neo4j folder in the GitHub repository kubedb/docs.
Find out Required Labels for ServiceMonitor
We need to know the labels used to select ServiceMonitor by a Prometheus CR. We will provide these labels in spec.monitor.prometheus.labels field of the Neo4j CR so that KubeDB creates a ServiceMonitor object accordingly.
Let’s find out the available Prometheus server in our cluster.
$ kubectl get prometheus --all-namespaces
NAMESPACE    NAME                                    VERSION              DESIRED   READY   RECONCILED   AVAILABLE   AGE
monitoring   prometheus-kube-prometheus-prometheus   v3.11.3-distroless   1         1       True         True        10m
If you don’t have any Prometheus server running in your cluster, deploy one following the guide specified in the Before You Begin section.
Now, let’s view the YAML of the available Prometheus server in monitoring namespace.
$ kubectl get prometheus -n monitoring prometheus-kube-prometheus-prometheus -o yaml
apiVersion: monitoring.coreos.com/v1
kind: Prometheus
metadata:
  name: prometheus-kube-prometheus-prometheus
  namespace: monitoring
  labels:
    app: kube-prometheus-stack-prometheus
    release: prometheus
spec:
  replicas: 1
  serviceMonitorSelector:
    matchLabels:
      release: prometheus
  serviceMonitorNamespaceSelector: {}
  ...
Notice the spec.serviceMonitorSelector section. Here, release: prometheus label is used to select ServiceMonitor CRs. So, we are going to use this label in spec.monitor.prometheus.labels field of the Neo4j CR.
Deploy Neo4j with Monitoring Enabled
Below is the Neo4j object that we are going to create with monitoring enabled.
apiVersion: kubedb.com/v1alpha2
kind: Neo4j
metadata:
  name: coreos-prom-neo4j
  namespace: demo
spec:
  replicas: 3
  deletionPolicy: WipeOut
  version: "2025.11.2"
  storage:
    storageClassName: local-path
    accessModes:
      - ReadWriteOnce
    resources:
      requests:
        storage: 2Gi
  monitor:
    agent: prometheus.io/operator
    prometheus:
      serviceMonitor:
        labels:
          release: prometheus
        interval: 10s
Here,
monitor.agent: prometheus.io/operatorindicates that we are going to monitor this server using Prometheus operator.monitor.prometheus.serviceMonitor.labelsspecifies that KubeDB should create aServiceMonitorwith these labels. We userelease: prometheusto match theserviceMonitorSelectorconfigured in the Prometheus CR above.monitor.prometheus.intervalindicates that the Prometheus server should scrape metrics from this database at a 10-second interval.
Let’s create the Neo4j object:
$ kubectl apply -f https://github.com/kubedb/docs/raw/v2026.4.27/docs/examples/neo4j/monitoring/coreos-prom-neo4j.yaml
neo4j.kubedb.com/coreos-prom-neo4j created
Now, wait for the database to go into Ready state.
$ kubectl get neo4j -n demo coreos-prom-neo4j
NAME                VERSION      STATUS   AGE
coreos-prom-neo4j   2025.11.2    Ready    3m
KubeDB will create a separate stats service with the name {Neo4j CR name}-stats for monitoring purposes.
$ kubectl get svc -n demo --selector="app.kubernetes.io/instance=coreos-prom-neo4j"
NAME                      TYPE        CLUSTER-IP      EXTERNAL-IP   PORT(S)                                                 AGE
coreos-prom-neo4j         ClusterIP   10.43.124.250   <none>        6362/TCP,7687/TCP,7474/TCP                              3m55s
coreos-prom-neo4j-0       ClusterIP   None            <none>        6362/TCP,7687/TCP,7474/TCP,7688/TCP,7000/TCP,6000/TCP   3m55s
coreos-prom-neo4j-1       ClusterIP   None            <none>        6362/TCP,7687/TCP,7474/TCP,7688/TCP,7000/TCP,6000/TCP   3m55s
coreos-prom-neo4j-2       ClusterIP   None            <none>        6362/TCP,7687/TCP,7474/TCP,7688/TCP,7000/TCP,6000/TCP   3m55s
coreos-prom-neo4j-stats   ClusterIP   10.43.214.74    <none>        2004/TCP                                                3m55s
Here, coreos-prom-neo4j-stats service has been created for monitoring purposes. It exposes metrics on port 2004.
Verify ServiceMonitor Creation
KubeDB will also create a ServiceMonitor CR in the demo namespace that selects the endpoints of coreos-prom-neo4j-stats service. Verify that the ServiceMonitor has been created.
$ kubectl get servicemonitor -n demo
NAME                      AGE
coreos-prom-neo4j-stats   6m8s
Let’s verify the ServiceMonitor YAML.
$ kubectl get servicemonitor -n demo coreos-prom-neo4j-stats -o yaml
apiVersion: monitoring.coreos.com/v1
kind: ServiceMonitor
metadata:
  labels:
    app.kubernetes.io/component: database
    app.kubernetes.io/instance: coreos-prom-neo4j
    app.kubernetes.io/managed-by: kubedb.com
    app.kubernetes.io/name: neo4js.kubedb.com
    release: prometheus
  name: coreos-prom-neo4j-stats
  namespace: demo
spec:
  endpoints:
  - honorLabels: true
    interval: 10s
    path: /metrics
    port: metrics
    relabelings:
    - action: replace
      sourceLabels:
      - __meta_kubernetes_endpoint_address_target_name
      targetLabel: pod
    scheme: http
  namespaceSelector:
    matchNames:
    - demo
  selector:
    matchLabels:
      app.kubernetes.io/component: database
      app.kubernetes.io/instance: coreos-prom-neo4j
      app.kubernetes.io/managed-by: kubedb.com
      app.kubernetes.io/name: neo4js.kubedb.com
      kubedb.com/role: stats
Notice that the ServiceMonitor carries the release: prometheus label that we specified in the Neo4j CR — this is exactly what the Prometheus server’s serviceMonitorSelector looks for.
The ServiceMonitor selects the coreos-prom-neo4j-stats service by matching its labels and scrapes the metrics port (2004) every 10 seconds.
Verify Monitoring Metrics
Let’s find out the Prometheus pod for our Prometheus server.
$ kubectl get pod -n monitoring -l app.kubernetes.io/name=prometheus
NAME                                                     READY   STATUS    RESTARTS   AGE
prometheus-prometheus-kube-prometheus-prometheus-0       2/2     Running   0          15m
The Prometheus server is listening on port 9090. We are going to use port forwarding to access the Prometheus dashboard.
Run the following command in a separate terminal to forward port 9090:
$ kubectl port-forward -n monitoring prometheus-prometheus-kube-prometheus-prometheus-0 9090
Forwarding from 127.0.0.1:9090 -> 9090
Forwarding from [::1]:9090 -> 9090
Now, open http://localhost:9090 in your browser. Navigate to Status → Targets and you should see the coreos-prom-neo4j-stats endpoint listed as an active scrape target.
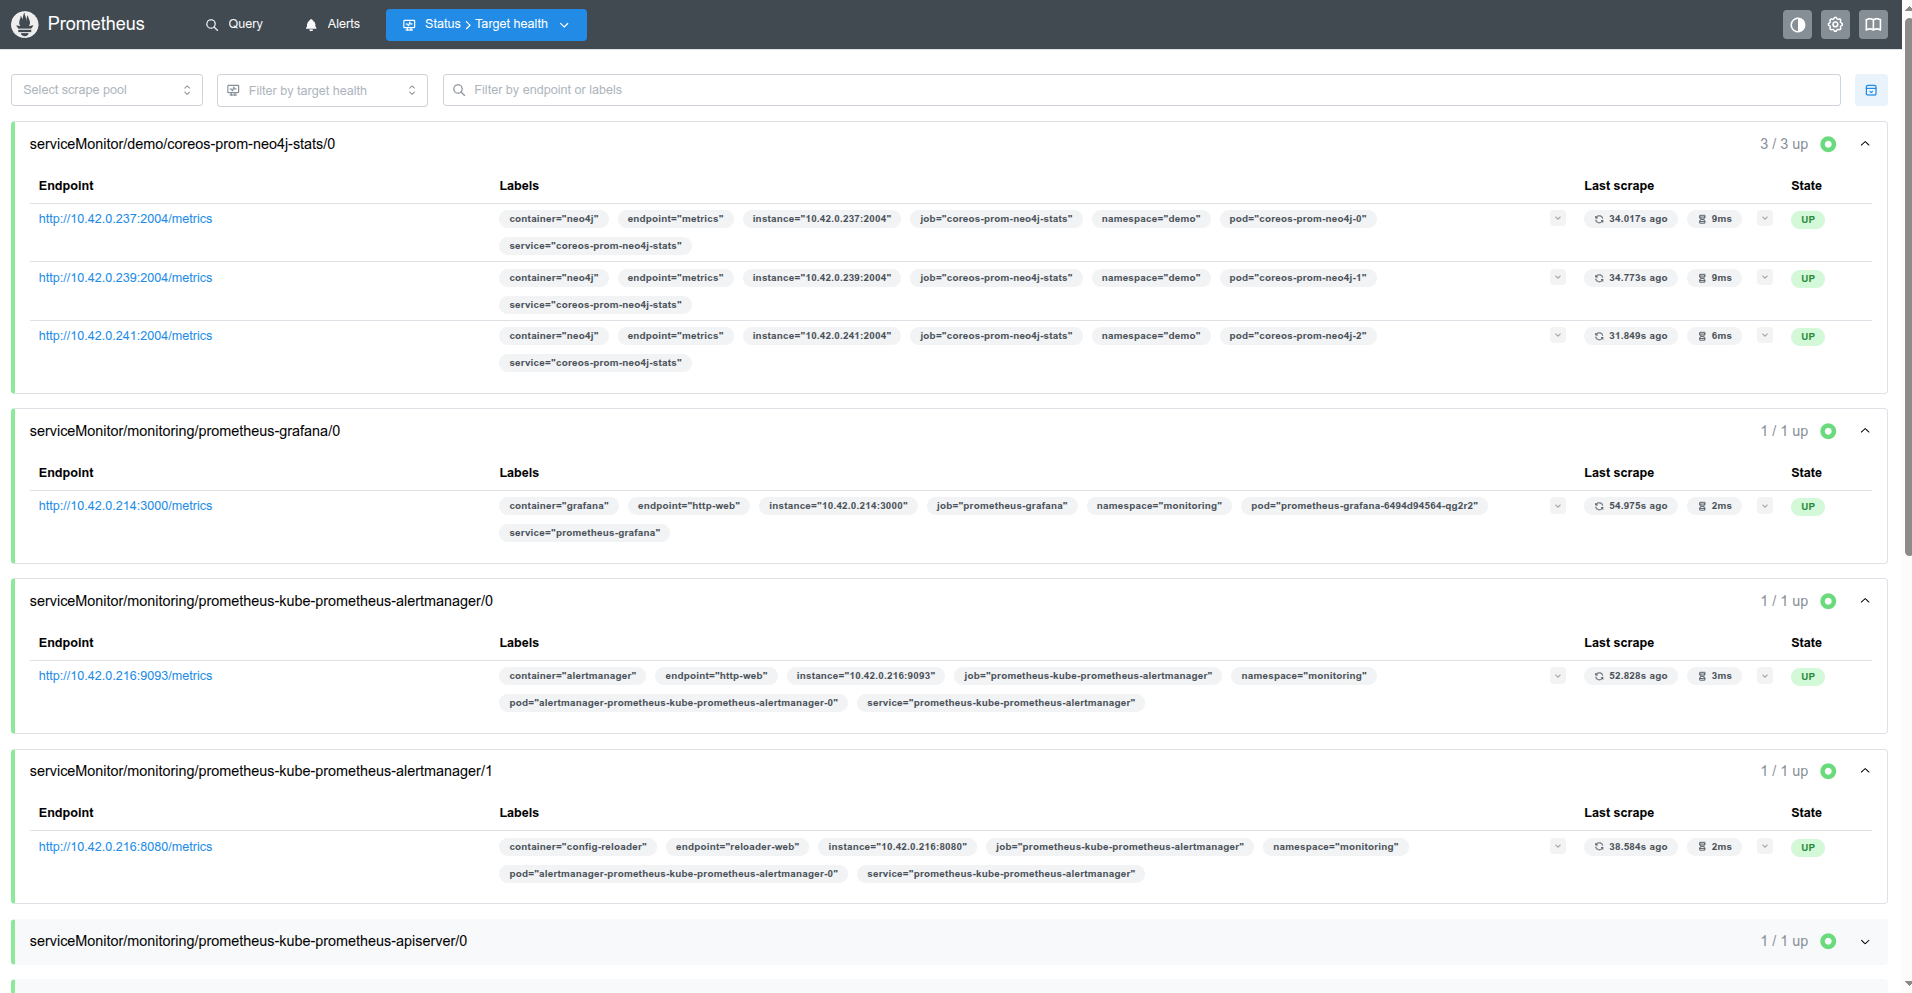
The endpoint and service labels confirm the target is our Neo4j database. You can now browse collected metrics from the Prometheus homepage and create graphs, or use this Prometheus server as a data source for Grafana to build dashboards.
Cleaning up
To clean up the Kubernetes resources created by this tutorial, run:
# delete the Neo4j database
kubectl patch -n demo neo4j/coreos-prom-neo4j -p '{"spec":{"deletionPolicy":"WipeOut"}}' --type="merge"
kubectl delete -n demo neo4j/coreos-prom-neo4j

# delete namespaces
kubectl delete ns demo
kubectl delete ns monitoring
Next Steps
- Monitor your Neo4j database with KubeDB using built-in Prometheus.
- Want to hack on KubeDB? Check our contribution guidelines.